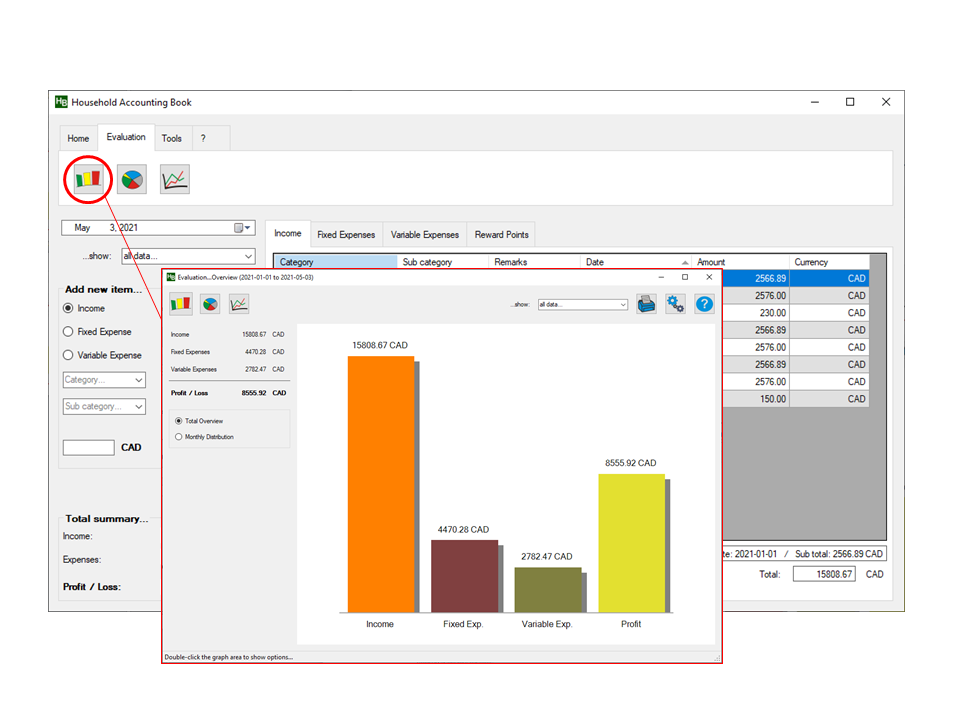
To visualize your data graphically, select a chart-type from the menu "Evaluation" (e.g. "Overview"). The window for graphic evaluation will appear.
Please note that some of the following functions are only available if you have the full version...

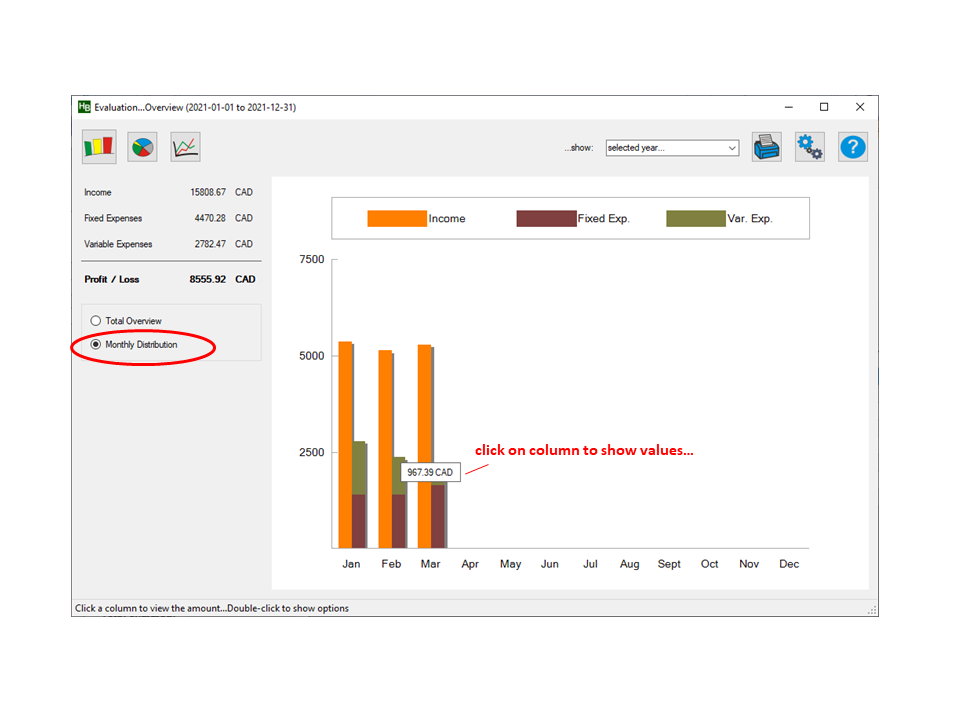
...If you select a time span of several months in the drop down menu (e.g. "Selected year") for the chart "Overview", you can show this chart also as "Monthly distribution"...

...To show the total amount of a certain column, just place the cursor over the column and click. A text field with the value will appear.