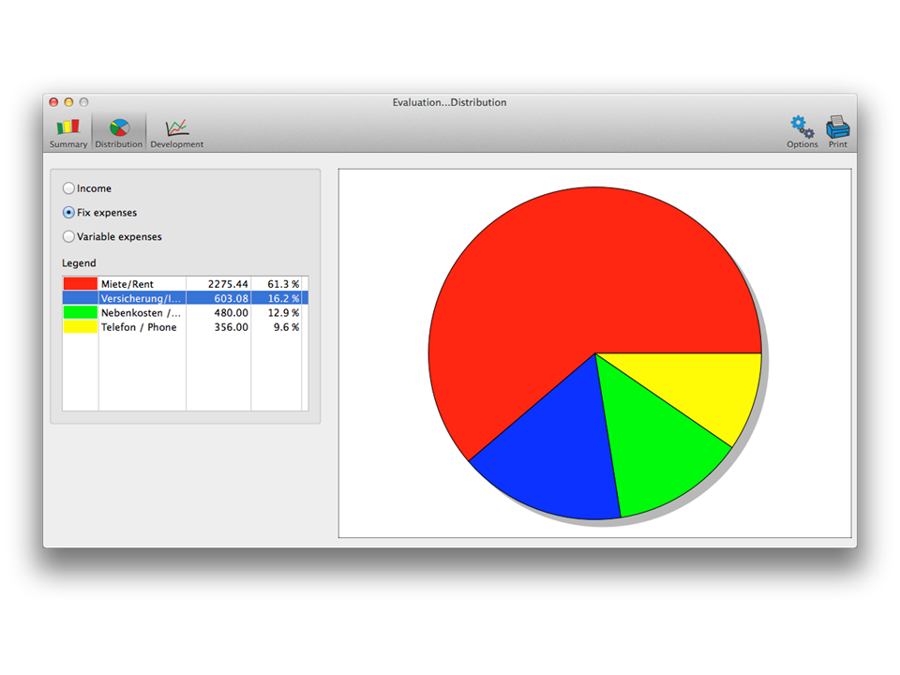
If you select "Distribution" in the toolbar, you will get a pie- or column chart showing the distribution of you income or expenses.
If you want to show the composition of a specific category, double-click the item in the legend. Another window will pop up, showing the distribution of sub-categories for this specific item...
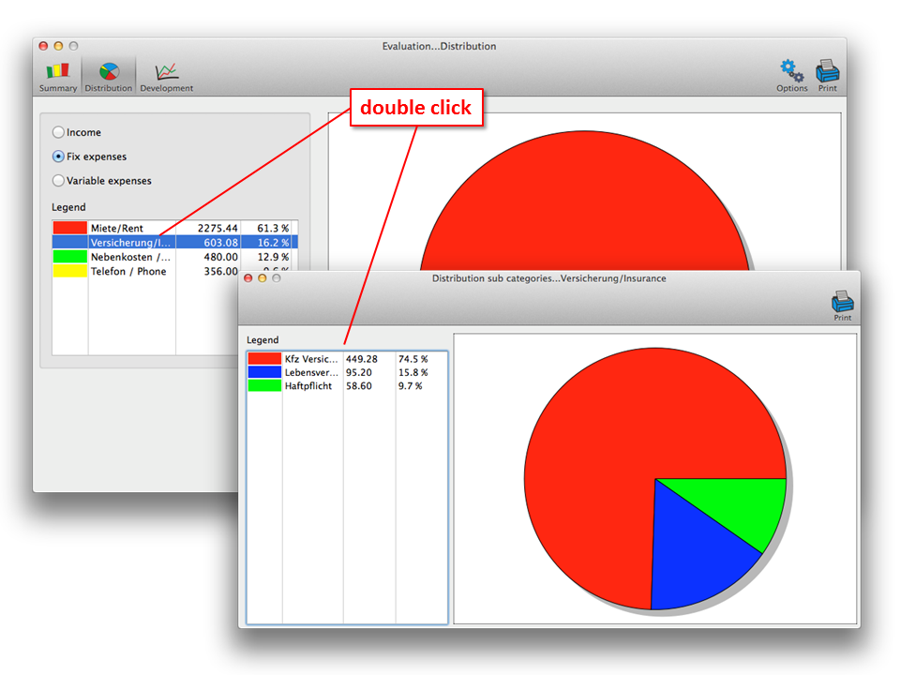
...with these tools, a very detailed analysis of your data is no problem.