Another interesting function is the chart "Development", which shows a trace of your income or expenses over the selected period of time...
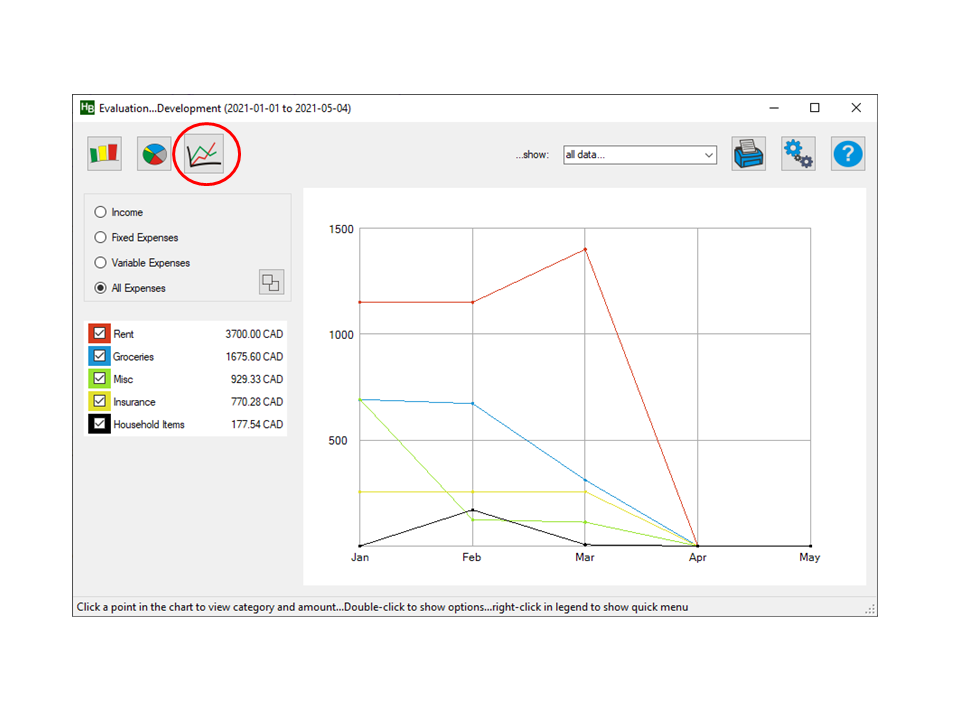
...The charts resolution will be daily for small intervals (up to 35 days), weekly for intermediate intervals (up to 3 months) and monthly for longer periods of time. To show or hide a specific category, simply check the box in the corresponding color field in the legend. The color of a specific category can be changed by double-clicking the color field.
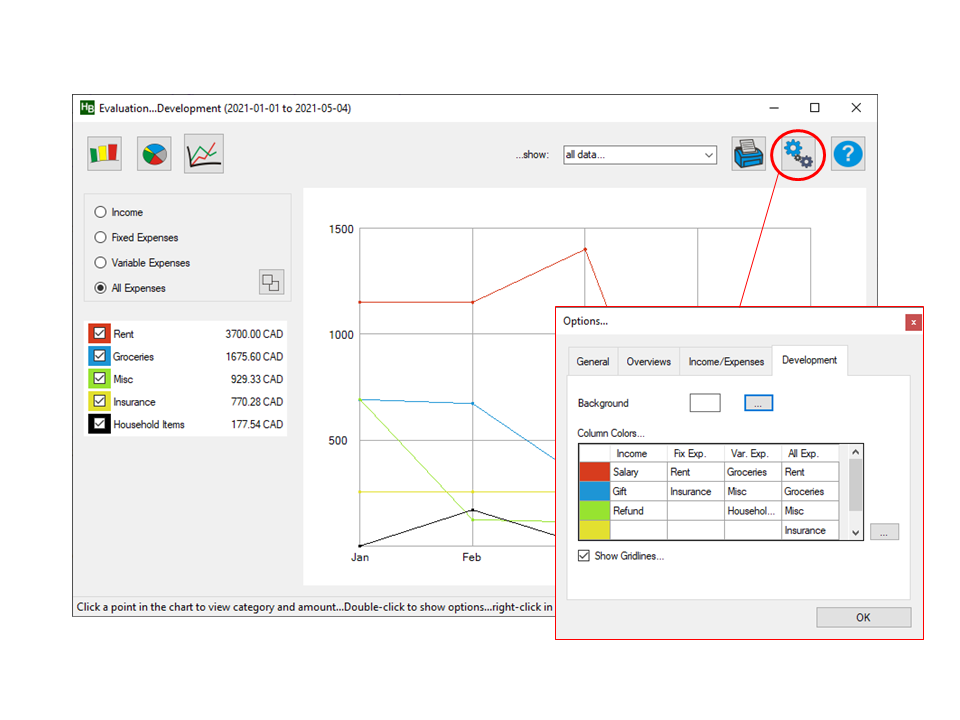
Click the "Options" button to adjust the properties of the charts to your preferences. Here you can choose types of diagrams, colors, shadows, grid-lines etc.